Intel beats on revenue and profit, posts a roughly $11B GAAP loss on a one-time charge — and the stock rose
Intel’s second-quarter revenue rose 25% to $16.13B and non-GAAP profit roughly doubled estimates, but a ~$12.5B non-cash charge tied to the U.S. government’s equity stake drove a large GAAP net loss. Both the operating beat and the paper loss are real — and the stock still rose after hours.

By David Weaver
Publisher & Editor
Published July 23, 2026, 4:28 PM ET
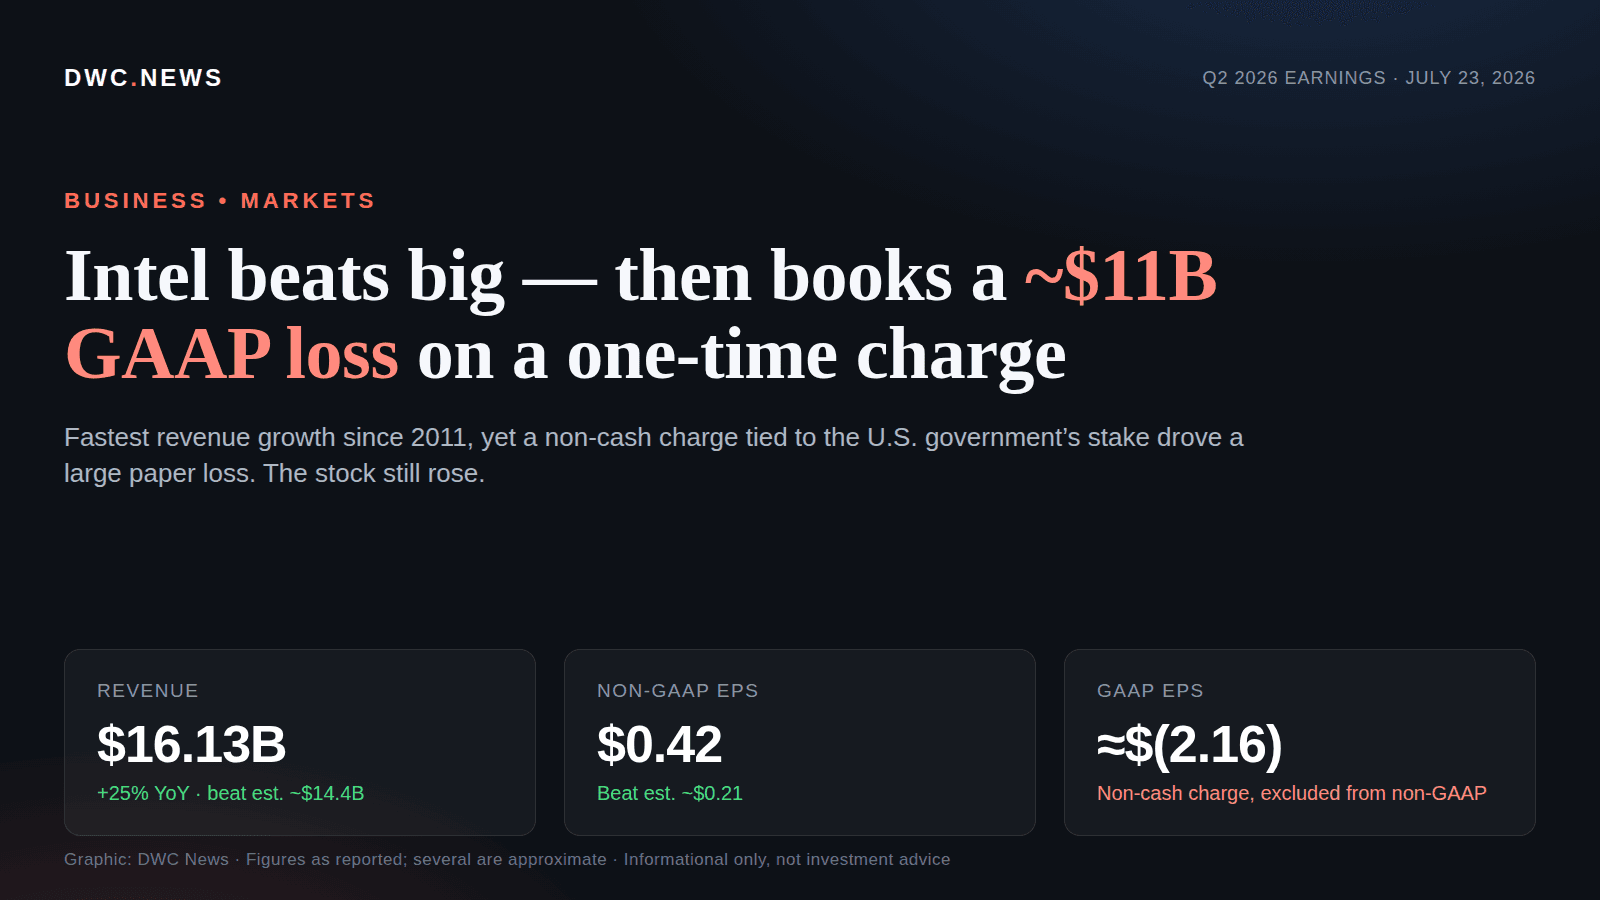
Intel just did two things that usually do not happen in the same press release: it blew past Wall Street’s estimates, and it reported a multibillion-dollar loss. Both are true. That is the whole story of the quarter.
For the three months ending in June, Intel reported revenue of $16.128B, up 25% year over year — its fastest growth since 2011 — comfortably ahead of the roughly $14.4B analysts expected, per Intel’s earnings release and CNBC’s report on the numbers. Non-GAAP earnings were $0.42 a share, roughly double the ~$0.21 consensus. Non-GAAP gross margin was 41.8%, up 12.1 points from 29.7% a year earlier. On the measures the company emphasizes, it was a decisive beat.
The loss and the beat are the same quarter
Now the other number. On a GAAP basis, Intel posted a net loss of approximately $11B, or about $(2.16) per share. Read that next to the $0.42 non-GAAP profit and it looks like a contradiction. It is not.
The gap is one line item: an approximately $12.5B non-cash, mark-to-market charge tied to the U.S. government’s roughly 10% equity stake in Intel. Because that stake is carried on the books at market value, a swing in its value flows through Intel’s GAAP results as a charge — even though no cash left the building. Intel’s non-GAAP figures exclude that charge, which is why the same quarter can show a healthy operating profit and a large accounting loss at the bottom line. (We flag the ~$11B loss and the ~$12.5B charge as approximate: those magnitudes were reported around the release rather than read line-by-line off the primary filing.)
Neither number is “the fake one.” GAAP and non-GAAP answer different questions — non-GAAP strips out one-time items to show the operating trend, GAAP includes everything that hit the books. The scorecard below lays the metrics side by side so you can see exactly where the two diverge, with a note reconciling them.
Intel Q2 2026 Earnings Scorecard
Intel's Q2 2026 earnings: reported figures vs. analyst estimates
The headline numbers from Intel's second-quarter 2026 report — revenue, non-GAAP and GAAP EPS, gross margin, the Client Computing and Data Center & AI segments and the Intel Foundry operating loss — each shown against the analyst estimate and the year-ago quarter. Reported figures only; no live prices and no investment advice.
This scorecard shows Intel's reported second-quarter 2026 figures for information only. It is not investment advice, contains no price targets or buy/sell recommendation, and does not show live stock prices, which change constantly. GAAP and non-GAAP are different measures: the GAAP loss reflects an approximately $12.5B non-cash charge that non-GAAP excludes. Verify any figure against Intel's official SEC filings before acting on it.
| Revenue | $16.128B (+25% YoY) | ≈$14.4B | Beat | ≈$12.9B |
| Non-GAAP EPS | $0.42 | ≈$0.21 | Beat | — |
| GAAP EPS | ≈$(2.16) (loss) | — | n/a — one-time non-cash charge | — |
| Non-GAAP gross margin | 41.8% | — | +12.1 pts YoY | 29.7% |
| Data Center & AI revenue | ≈$6.3B (+59% YoY) | — | Growth engine | ≈$4.0B |
| Client Computing revenue | ≈$8.9B (+13% YoY) | — | — | ≈$7.9B |
| Intel Foundry operating loss | ≈$2.4B (operating loss) | — | Still lossmaking | — |
How this is calculated
Figures are as reported in Intel's second-quarter 2026 earnings release (Intel Investor Relations) and its SEC Form 8-K, plus reporting by CNBC and StockTitan. Revenue and non-GAAP EPS are the two metrics for which a consensus analyst estimate was reported (by CNBC), so a Beat/Miss verdict is only shown for those two. GAAP vs. non-GAAP reconciliation: Intel's GAAP results include an approximately $12.5B non-cash mark-to-market charge tied to the U.S. government's roughly 10% equity stake in Intel; that charge is excluded from non-GAAP results. This is why non-GAAP EPS is a positive $0.42 while GAAP EPS is an approximate loss of $(2.16). Year-ago figures for revenue and the two segments are implied by Intel's reported year-over-year growth rates and are marked approximate; the year-ago non-GAAP gross margin (29.7%) is stated directly in Intel's release. Amounts labeled 'approximately' were not read directly off the primary Form 8-K and are rounded.
Data as of July 22, 2026 · verified July 22, 2026 · v1
Assumptions, limitations & sources
Assumptions
- · The reported quarter is Intel's fiscal Q2 2026 (quarter ended June 2026), released after the U.S. market close on Thursday, July 23, 2026.
- · Analyst-estimate figures reflect the consensus reported by CNBC at the time of the release and are shown only for revenue and non-GAAP EPS.
- · Year-ago revenue (~$12.9B), Data Center & AI (~$4.0B) and Client Computing (~$7.9B) are implied by Intel's reported year-over-year growth rates, not read line-by-line off the Q2 2025 release.
Limitations
- · The GAAP net loss of approximately $11B, the approximately $12.5B non-cash mark-to-market charge, and the approximately $170M of Intel Foundry external revenue were not read directly off the primary Form 8-K; they are approximate and are flagged as such.
- · GAAP and non-GAAP are different measures. Non-GAAP excludes the mark-to-market charge and other items; neither number is 'the real one' — they answer different questions, and Intel reports both.
- · This is a single-quarter snapshot. Stock price, market value, after-hours moves and forward guidance change constantly and are deliberately not part of this table.
- · A Beat/Miss verdict is shown only where a consensus estimate was reported; segment and margin rows show the year-over-year comparison instead.
Sources
- Intel Reports Second-Quarter 2026 Financial Results (press release) — Intel Corporation (Investor Relations), checked July 22, 2026
- Intel Corporation Form 8-K — Q2 2026 earnings release exhibit — U.S. Securities and Exchange Commission, checked July 22, 2026
- Intel (INTC) earnings Q2 2026 (revenue and EPS vs. estimates) — CNBC, checked July 22, 2026
- Intel Reports Second Quarter 2026 Financial Results (analysis) — StockTitan, checked July 22, 2026
- Intel Needs More Than Blowout Earnings as Chips Rally Falters — Bloomberg, checked July 22, 2026
This is what modern SEO looks like: not just an article, but a useful resource people can return to, cite, and share. See how this newsroom is growing · See DavidWeaver's SEO packages
Under the hood: the growth engine and the money pit
The segment detail explains where the 25% came from. Data Center & AI revenue rose about 59% to roughly $6.3B — the quarter’s clear growth engine, riding demand for AI infrastructure. Client Computing, Intel’s PC-chip business, grew about 13% to roughly $8.9B. Together they carried the top line.
Intel Foundry remains the hard part of the turnaround. The contract-manufacturing arm posted an operating loss of about $2.4B and, per reporting on the release, still has no marquee external customer signed (external foundry revenue was small — approximately $170M, a figure we treat as approximate). The build-out of a competitive foundry is a multiyear, capital-heavy project, and this quarter it stayed deeply in the red.
Guidance up; the hard problems unchanged
Intel guided third-quarter revenue to $15.8B–$16.8B and non-GAAP EPS to about $0.38, both above consensus — a sign management sees the demand continuing. What did not change is as telling: Lip-Bu Tan remains CEO, the dividend stays suspended (no reinstatement was announced), and the 18A process node — Panther Lake — is in high-volume manufacturing. The strategy is intact; the Foundry losses and the absent anchor customer are the open questions the beat did not answer, a point Bloomberg pressed in its coverage.
Why the stock rose — but only so much
Shares moved up after hours, but the exact figure depends on where you looked: reports put the gain in a range of roughly +12% to +13.5%. Notably, that is muted versus the +23.6% jump after Q1 — because, this time, a strong quarter was largely priced in already. A beat that everyone expected moves a stock less than a beat that no one did. Intel’s Q2 documentation and reporting on it, including StockTitan’s summary and the SEC Form 8-K, are the record for the figures above.
The honest one-line version: Intel’s operating results beat sharply, an accounting charge tied to Washington’s stake produced a large paper loss, and investors — who had mostly expected the beat — nudged the stock higher rather than sending it soaring.
Informational only. This article and the scorecard report figures as disclosed and are not investment advice. They contain no price targets and no buy, sell, or hold recommendation. GAAP and non-GAAP are different measures; several figures here are approximate and noted as such. Verify any number against Intel’s official SEC filings before acting on it.
Sources
- Intel Reports Second-Quarter 2026 Financial Results (press release) — Intel Corporation (Investor Relations) · primary source
- Intel Corporation Form 8-K — Q2 2026 earnings release exhibit — U.S. Securities and Exchange Commission
- Intel (INTC) earnings Q2 2026 — CNBC
- Intel Reports Second Quarter 2026 Financial Results (analysis) — StockTitan
- Intel Needs More Than Blowout Earnings as Chips Rally Falters — Bloomberg