The 2026 ‘super El Niño’ forecast: a strong bet for winter, not a done deal
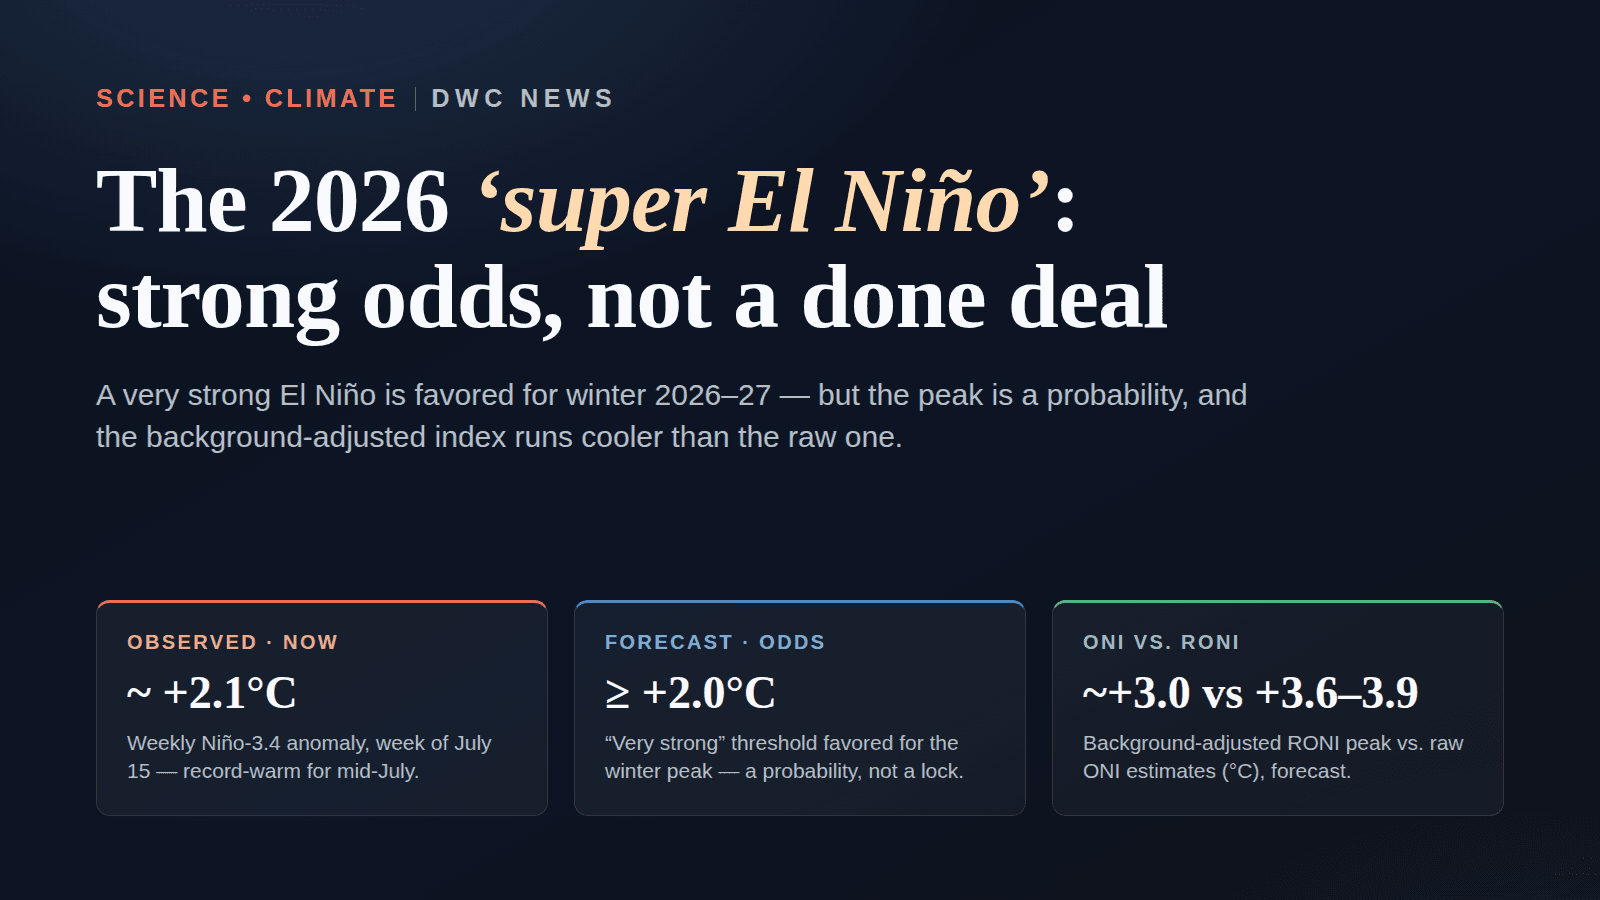
Forecasters put strong odds on a very strong — ‘super’ — El Niño peaking next winter, with a real chance of the strongest on record. But the headline numbers are probabilities, and the raw index overstates it. Here is what is observed versus forecast, and what NOAA’s RONI shows.

By David Weaver
Publisher & Editor
Published July 23, 2026, 5:37 PM ET
“Super El Niño.” “Strongest on record.” “The hottest year is coming.” The phrases were everywhere this week — and almost every one of them is a probability wearing the costume of a fact.
So let us separate the two. A very strong El Niño really is the strong forecast for next winter. But the eye-popping peak numbers are odds, the rawest index oversells the event, and two of the scariest figures trace back to a single analyst lineage. Here is what is actually measured today versus what is only forecast.
First, what happened on July 23 — and what did not
No single official document is stamped July 23, 2026. The surge in “super El Niño” coverage is media attention catching up to the mid-July outlooks, not a new data release. The underlying products are the NOAA Climate Prediction Center/IRI ENSO Diagnostic Discussion issued July 9, the July IRI Quick Look, and the July SPEAR model runs from NOAA’s GFDL, amplified by press coverage. So treat the timing as peaking coverage of the mid-July outlooks — not a single July 23 event.
The words, defined — because “super” is doing a lot of work
NOAA measures El Niño strength with the Oceanic Niño Index (ONI): the three-month running mean of the sea-surface-temperature anomaly in the Niño-3.4 region of the tropical Pacific, with the winter peak conventionally taken over December–January–February. NOAA’s strength tiers are fixed:
- Weak: +0.5 to +0.9°C
- Moderate: +1.0 to +1.4°C
- Strong: +1.5 to +1.9°C
- Very strong: at or above +2.0°C
“Super El Niño” is an informal label — it is not an official NOAA category. It is used loosely to mean roughly a very strong event, an ONI at or above +2.0°C. Keep that in mind whenever you see the word: it is shorthand, not a threshold NOAA publishes.
Observed now vs. forecast for winter
Two things are observed. An El Niño Advisory is in effect, and the weekly Niño-3.4 anomaly sat near +2.1°C for the week of July 15, which is record-warm for mid-July. That is measured, not modeled.
Almost everything else in the headlines is forecast. A very strong (“super”) El Niño is the strong forecast consensus for winter 2026–27, and there is a realistic chance it ends up the strongest in the instrumental record. But the peak magnitude is a probability, not a certainty — so the honest verbs are “favored,” “likely,” and “odds,” never “will.”
The correction that reframes the whole story: ONI vs. RONI
Here is the part most of the coverage skips. The raw ONI looks record-shattering partly for a reason that has nothing to do with this particular El Niño: the whole tropical ocean is warmer than it used to be, because background and climate-change warming lifted the entire baseline. An index measured against that raised baseline reads high almost by construction.
NOAA built a fairer gauge for exactly this problem: the Relative Oceanic Niño Index (RONI). RONI subtracts the tropical-mean ocean warming from the Niño-3.4 anomaly, isolating how strong the actual El Niño pattern is rather than how warm the ocean is overall. On the NOAA CPC RONI page, that background-adjusted view runs cooler than the raw ONI. For this event, the forecast RONI peak is around +3.0°C, against raw ONI peak estimates near +3.6 to +3.9°C. Both are very strong. But RONI is the number to reach for when someone asks “how big is the El Niño itself,” and it trims the most sensational edge off the raw figure.
The odds — kept honest, and kept separate
Read these as probabilities, and mind the windows:
- El Niño persists through winter (DJF): roughly a 96–98% chance, per the CPC/IRI outlooks.
- “Very strong” (ONI at or above +2.0°C): about 81% for the October–December window, but about 63% for November–January. Those are different three-month windows — do not merge or average them.
Two further figures are widely quoted and worth flagging. Reporting — notably Yale Climate Connections — puts roughly a 90% chance on this being the strongest El Niño in the instrumental record and more than 80% odds that 2027 becomes the warmest year on record. Both are credible, but they trace mainly to a single analyst lineage (Hausfather/Henson) rather than an independent multi-agency consensus. That does not make them wrong; it means they should be attributed and hedged, not repeated as settled fact.
What it could mean on the ground — again, as odds
El Niño winters tilt the odds; they do not dictate outcomes. Based on the typical pattern, this winter’s odds favor a wetter southern tier — the Gulf Coast, Southern California, and the Southwest — a drier Pacific Northwest and northern Rockies, and a warmer northern tier. None of that is guaranteed for any single storm or month.
One impact runs the other way from what people expect. A strong El Niño tends to suppress Atlantic hurricanes by raising wind shear over the basin, and NOAA’s 2026 outlook predicts a below-normal season: 8 to 14 named storms, 3 to 6 hurricanes, and 1 to 3 major hurricanes. A record ocean in one index, and a quieter-than-usual hurricane season, are both consistent with the same El Niño.
The explorer below lays every value out with its tag — observed or forecast — and its source, including the ONI tiers and the ONI-versus-RONI split, so you can see which numbers are measured and which are bets.
Observed vs. Forecast: Read the El Niño Numbers Honestly
ENSO outlook explorer: what's observed now vs. what's forecast for a 2026-27 El Niño
A searchable table of the July 2026 El Niño outlook that tags each value OBSERVED or FORECAST, defines NOAA's ONI strength tiers and the raw-ONI-vs-RONI distinction, and states the peak-strength and records claims as odds rather than certainty.
| ONI strength tiers (definition) | ONI = 3-month running mean of the Niño-3.4 SST anomaly (winter peak = DJF). Tiers: weak +0.5 to +0.9, moderate +1.0 to +1.4, strong +1.5 to +1.9, very strong ≥ +2.0°C. | Definition | NOAA CPC |
| "Super El Niño" (definition) | Informal term, not an official NOAA category; used to mean roughly a "very strong" event — an ONI at or above +2.0°C. | Definition | NOAA CPC / Yale Climate Connections |
| ONI vs. RONI (definition) | RONI (Relative Oceanic Niño Index) subtracts the tropical-mean SST anomaly from the Niño-3.4 anomaly, removing background/climate-change ocean warming — a fairer gauge of how strong the actual El Niño is versus the raw ONI. | Definition | NOAA CPC RONI |
| Current ENSO status | El Niño Advisory in effect (El Niño conditions present). | Observed | NOAA CPC / IRI |
| Weekly Niño-3.4 anomaly | About +2.1°C for the week of July 15, 2026 — record-warm for mid-July. | Observed | NOAA CPC / IRI |
| El Niño persists through winter (DJF) | About a 96-98% chance El Niño continues through the December-February season. | Forecast | NOAA CPC / IRI |
| "Very strong" (≥ +2.0°C) — Oct-Dec window | About an 81% chance the ONI reaches the very-strong threshold in Oct-Dec 2026. | Forecast | IRI Quick Look |
| "Very strong" (≥ +2.0°C) — Nov-Jan window | About a 63% chance in the Nov-Jan window — a different three-month period from the Oct-Dec figure above; do not merge them. | Forecast | IRI Quick Look |
| Forecast peak ONI (raw) | Peak estimates around +3.6 to +3.9°C for winter 2026-27 — record territory. Trace mainly to one analyst lineage; treat as an odds-based estimate, not agency consensus. | Forecast | Yale Climate Connections / GFDL |
| Forecast peak RONI (background-adjusted) | Around +3.0°C — smaller than the raw ONI because it removes background ocean warming, but still comfortably very strong. The fairer 'how strong is the El Niño itself' number. | Forecast | NOAA CPC RONI / Yale Climate Connections |
| Strongest El Niño in the instrumental record | Reported around a 90% chance. Attributed to a single analyst lineage (Hausfather/Henson) rather than multi-agency consensus — credible but not independently confirmed. | Forecast | Yale Climate Connections |
| 2027 the warmest year on record | Reported at more than 80% odds, driven partly by this El Niño. Same single-analyst lineage caveat applies; attribute and hedge. | Forecast | Yale Climate Connections |
| U.S. winter — southern tier (Gulf Coast, S. California, Southwest) | Odds favor a wetter-than-normal winter — a typical El Niño tilt, not a guarantee. | Forecast | NOAA CPC |
| U.S. winter — Pacific Northwest / northern Rockies | Odds favor a drier-than-normal winter. | Forecast | NOAA CPC |
| U.S. winter — northern tier | Odds favor a warmer-than-normal winter across the northern states. | Forecast | NOAA CPC |
| 2026 Atlantic hurricane season | NOAA predicts below-normal activity — 8-14 named storms, 3-6 hurricanes, 1-3 major — because El Niño tends to raise Atlantic wind shear that suppresses storms. | Forecast | NOAA hurricane outlook |
How this is calculated
Each row is a single measure, definition, or impact from NOAA Climate Prediction Center (CPC)/IRI ENSO products (the July 9, 2026 ENSO Diagnostic Discussion and the July IRI Quick Look), NOAA GFDL's July 2026 SPEAR runs, NOAA's 2026 Atlantic hurricane outlook, and reporting from Yale Climate Connections. The 'Observed or Forecast' column marks whether a value is measured (observed) or a probabilistic outlook (forecast); definitions are labeled as such. Probabilities are reproduced as reported for the specific calendar window named; the Oct-Dec and Nov-Jan 'very strong' odds are different three-month windows and are kept as separate rows. Peak-magnitude decimals and the 'strongest on record' / 'warmest 2027' odds trace mainly to a single analyst lineage and are attributed and hedged in the row text, not stated as agency consensus.
Data as of July 22, 2026 · verified July 22, 2026 · v1
Assumptions, limitations & sources
Assumptions
- · Values reflect the mid-July 2026 official products and the coverage peaking around July 23, 2026; ENSO outlooks are reissued monthly and the odds move.
- · ONI is the three-month running mean of the Niño-3.4 sea-surface-temperature anomaly; the winter peak is conventionally the December-January-February (DJF) value.
- · Probabilities are shown for the exact calendar window named in the source and are not merged across windows.
Limitations
- · This is an outlook, not an outcome. Every peak-strength, record, and impact value in the forecast rows is a probability; none is guaranteed, and none should be read as 'will happen.'
- · The peak ONI decimals (~+3.6 to +3.9°C), the peak RONI (~+3.0°C), the ~90% 'strongest on record' figure, and the >80% 'warmest 2027' figure trace mainly to one analyst lineage (Hausfather/Henson via Yale Climate Connections) — credible, but not independently confirmed across multiple agencies.
- · The Oct-Dec (~81%) and Nov-Jan (~63%) 'very strong' odds are different three-month windows; comparing them directly, or averaging them, is a mistake.
- · No single official document is dated July 23, 2026 — the spike is media coverage of the mid-July outlooks, not a new data release that day.
Sources
- ENSO Diagnostic Discussion (El Niño Advisory; status and probabilities), issued July 9, 2026 — NOAA Climate Prediction Center / IRI, checked July 22, 2026
- IRI ENSO Forecast — July 2026 Quick Look (probabilistic strength by three-month window) — International Research Institute for Climate and Society (Columbia), checked July 22, 2026
- Relative Oceanic Niño Index (RONI) — strengths and background-warming adjustment — NOAA Climate Prediction Center, checked July 22, 2026
- GFDL SPEAR July 2026 El Niño predictions (model peak-strength runs) — NOAA Geophysical Fluid Dynamics Laboratory, checked July 22, 2026
- NOAA predicts a below-normal 2026 Atlantic hurricane season (named-storm ranges) — National Oceanic and Atmospheric Administration, checked July 22, 2026
- This could be the strongest El Niño on record (peak decimals, records odds — attributed, single-analyst lineage) — Yale Climate Connections, checked July 22, 2026
This is what modern SEO looks like: not just an article, but a useful resource people can return to, cite, and share. See how this newsroom is growing · See DavidWeaver's SEO packages
The bottom line
A very strong “super” El Niño is genuinely the strong forecast for winter 2026–27, and a record is on the table. But strip away the certainty the headlines borrow: the peak magnitude is a probability, the raw ONI overstates the event next to the background-adjusted RONI, the “very strong” odds differ by window, and the most dramatic records claims lean on one analyst lineage. This is a developing outlook that will be reissued monthly — the odds, not the certainties, are the story.
Sources
- ENSO Diagnostic Discussion (El Niño Advisory, status and probabilities), issued July 9, 2026 — NOAA Climate Prediction Center / IRI · primary source
- IRI ENSO Forecast — July 2026 Quick Look (probabilistic strength by window) — International Research Institute for Climate and Society
- Relative Oceanic Niño Index (RONI) — strengths and background-warming adjustment — NOAA Climate Prediction Center
- GFDL SPEAR July 2026 El Niño predictions (model peak-strength runs) — NOAA Geophysical Fluid Dynamics Laboratory
- NOAA predicts a below-normal 2026 Atlantic hurricane season — National Oceanic and Atmospheric Administration
- This could be the strongest El Niño on record (peak estimates, records odds) — Yale Climate Connections